If you’ve done any research on tracking data on your website, you’ve probably heard about Google Analytics. But what exactly does Google Analytics do?
Google Analytics is a free website analytics service offered by Google that gives you insights into how users find and use your website. With Google Analytics, you can track return on investment (“ROI”) for your online marketing.
You can sift & sort your visitors with dozens of “dimensions” like where they came from, what browser they are using, etc and with “metric” like what page they clicked on and what form they submitted.
You can seamlessly integrate Google Products like your Ads account & Search Console. You can also use tracking codes to tag & track any advertising, social, PR campaign or any kind of campaign on any platform/website.
All you have to do is install a small amount of “tracking code” with a unique tracking ID on each page of your website.*
*Installation varies depending on your website software. If you are using self-hosted WordPress, then you just paste it in your theme’s header or use a plugin. If you are using a hosted builder like Wix, Squarespace, Google Sites, GoDaddy, Weebly, Jimdo, or Sitebuilder – then you’ll use their built-in embed option. Not all customization options will be available with all platforms (ie, Wix vs. WordPress). You can also use Google Tag Manager to install not only the Google Analytics code but also other tags from Facebook, Twitter, and other data sources.
*Quick aside – all the screenshots in this post are real to show real Google Analytics data in action. They are taken from several websites that I own. The date ranges have been changed on each & I’ve blocked any sensitive data.
How does Google Analytics track data?
Google Analytics tracks all of its data by a unique tracking code that you install on every page of your website. This code is a small snippet of Javascript, or a coding language, that runs in viewers’ browser when they visit those pages.
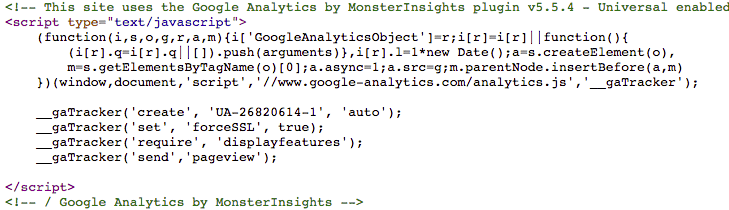
The Javascript code works with a larger JavaScript file on the Google server to collect information on the user’s activity on the site. Each time they visit the site, the code tracks information about their visit. The code also sets a cookie on each visitor’s device (via IP address), which provides anonymous information to create user i.d.s.
To get more in-depth information on traffic source, you can use UTM parameters. These are tags that you add to the end of your URL to provide Google Analytics with more information about your links, such as what campaign your content is coming from and which social channel is driving the most revenue.
What does Google Analytics measure?
The building blocks of Google Analytics reports are dimensions and metrics.
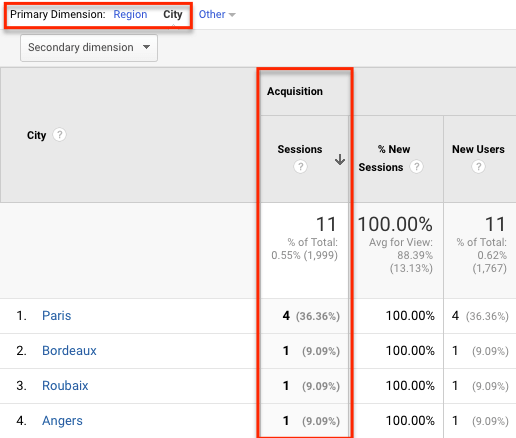
Dimensions are the attributes of your data, such as the city where traffic is coming from, the page you’re measuring, or the social media channel you’re evaluating.
Metrics are the quantitative measurements for those dimensions. For example, if you’re looking at how your ads are performing in Paris (the dimension), the 2,000 paid sessions you’ve recorded would be your metric.
Metrics and dimensions make up every single report in Google Analytics.
What can you do with Google Analytics?
In short, Google Analytics helps you make marketing campaign decisions based on data. You can justify spending more on your advertising, discover where you should be advertising, and even determine what types of content you need to be putting out there.
Google Analytics categorizes data into the ABCs:
- Acquisition
- Behavior
- Conversions
Additionally, you can use it to break down your Audience & Real-Time traffic. I’ll break these down a bit more.
Acquisition
Acquisition refers to how you get website traffic / website visitors. Simply put, you can use acquisition reports to see how your traffic arrives to your site.
When you first look under Acquisition report on your Google Analytics Dashboard, you’ll notice the Overview tab gives you an all-encompassing snapshot of acquisition, behavior, and conversion data for your top traffic sources by channel (referral, direct, organic search, and social).
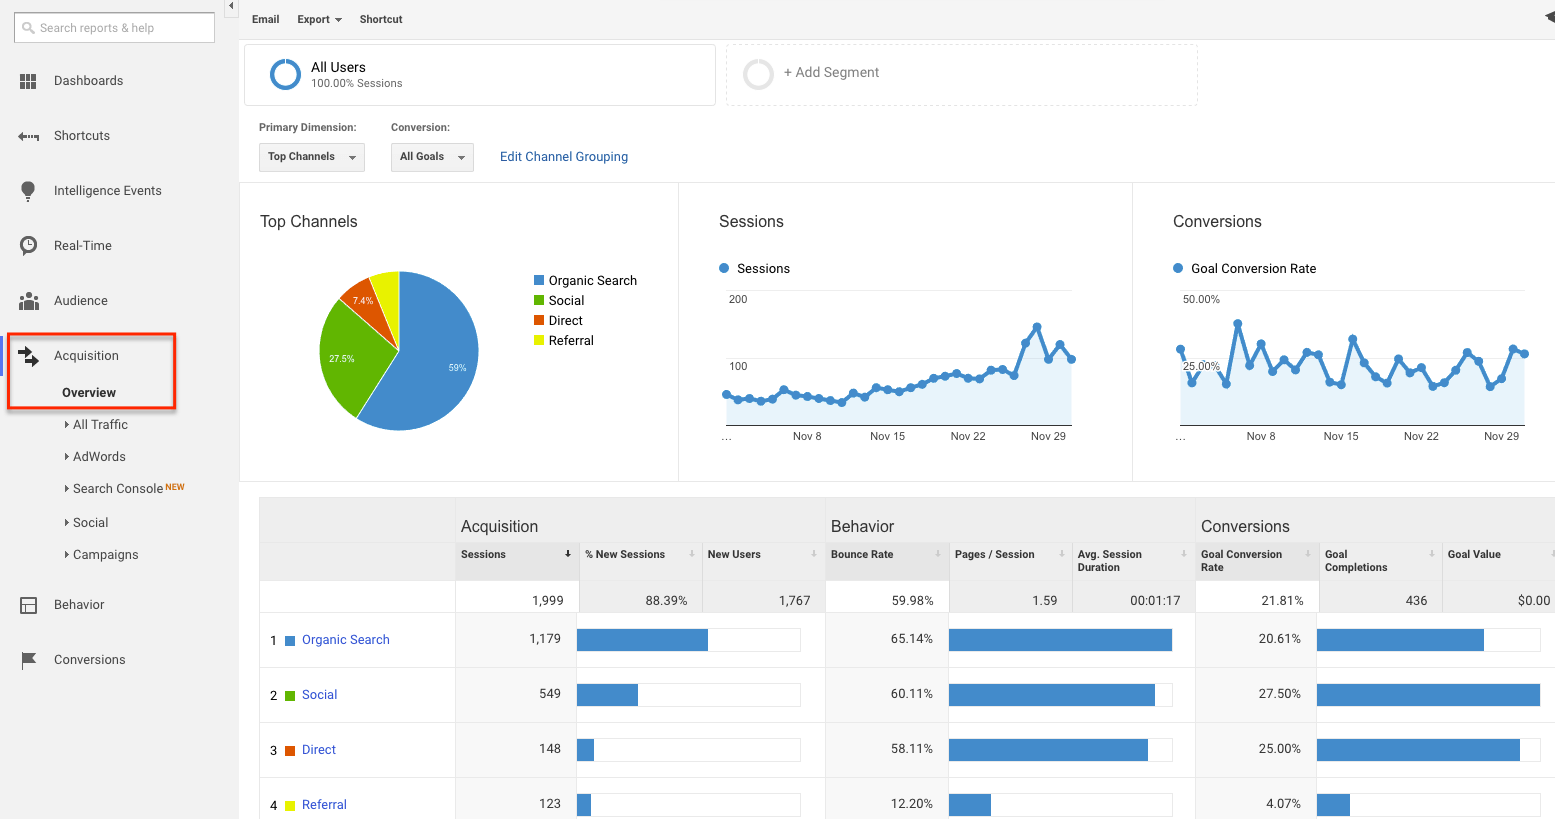
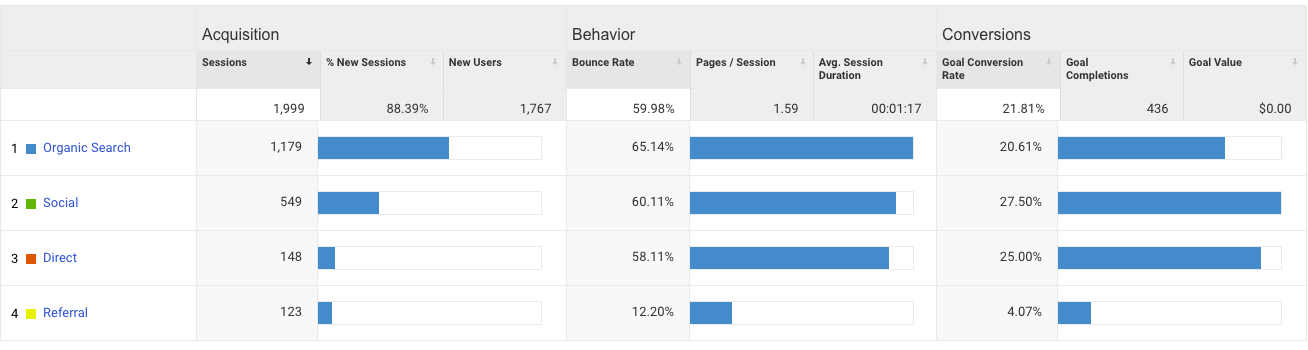
This is giving you the most important data right up front — the number of sessions acquired, the bounce rate of those acquired visitors, and their conversions for your most effective channels. It provides a quick and easy way to see how your top channels are performing.
Acquisition reports are a great way to look at which avenues are best for bringing traffic to your site and getting certain actions to happen. Using other views will allow you to look at different types of traffic.
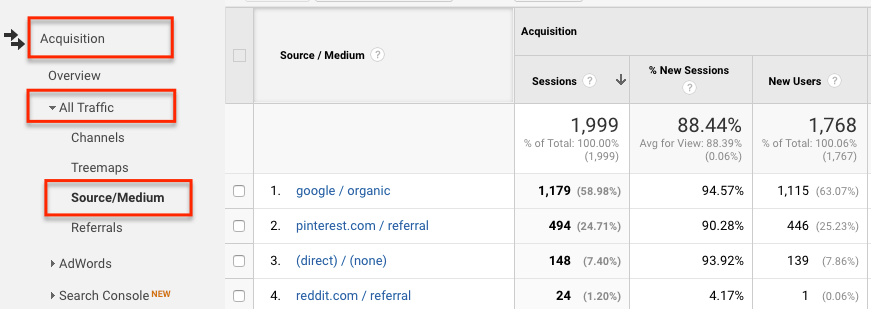
For example, say you want to know which search engine is driving the most organic traffic. By using the Source/Medium view, you can drill down to see the individual sources and mediums acquired the most customers (such as google/organic vs. bing/organic).
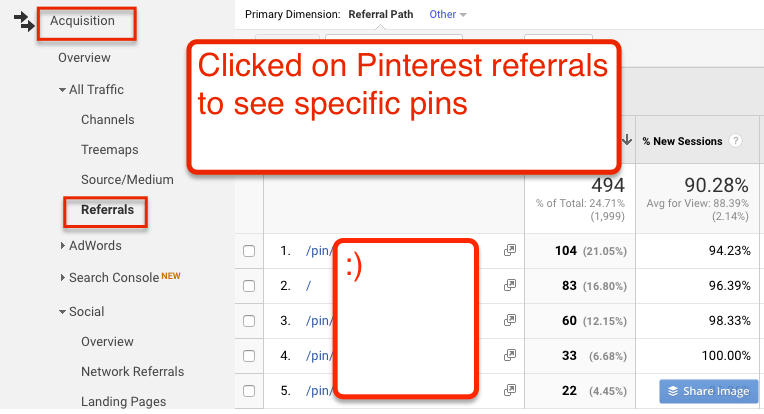
Or, you can explore which referral sources are responsible for driving the most referral traffic to your site by looking at the Referral view. Use this information to make decisions about where you promote content. For example, if you find that Pinterest is driving a significant amount of people to your site, work on publishing content there.
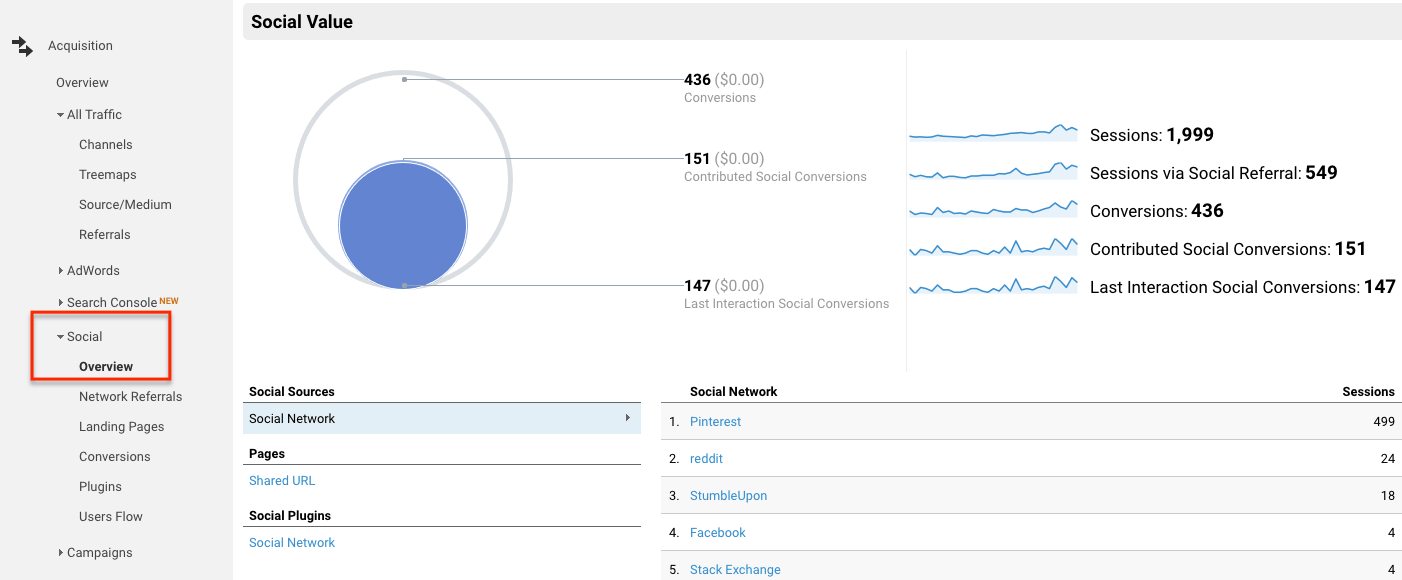
If you just want to look at social referrals, check out the Social tab. This focuses on just social media traffic. Use this tab to discover the networks where people engage with your content. You can also identify which content performs best in each community. For example, you may find your broader entertainment content performs better on Facebook, while your business-related content performs well on LinkedIn.
The great thing about Google Analytics is how it integrates with other tools. The Acquisition section can integrate with your Ads account so you can track how your campaigns are performing in terms of acquiring customers.
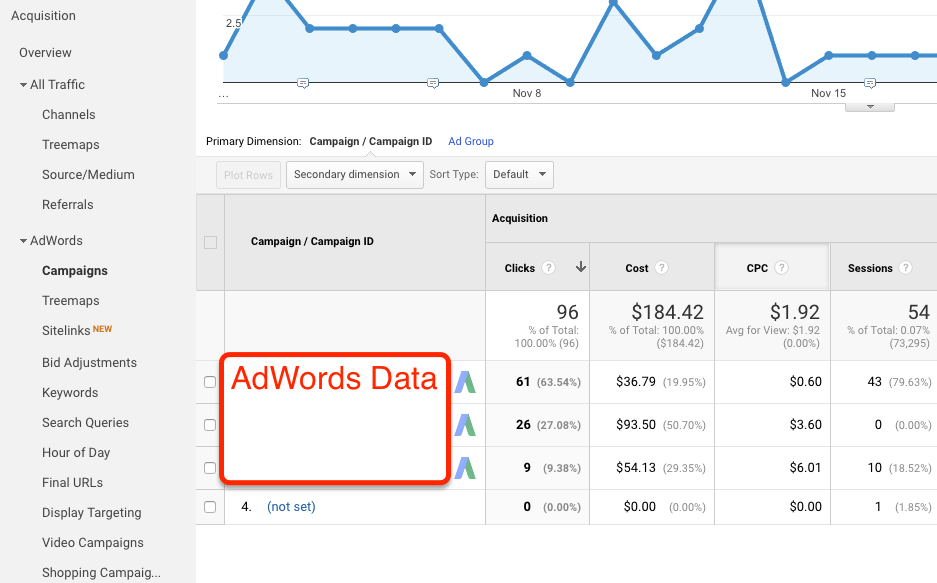
Use the Ads section to see how keywords are performing and to identify popular search queries that drive traffic to your site. Use this information to create more targeted campaigns based on popular queries and topics people are searching for.
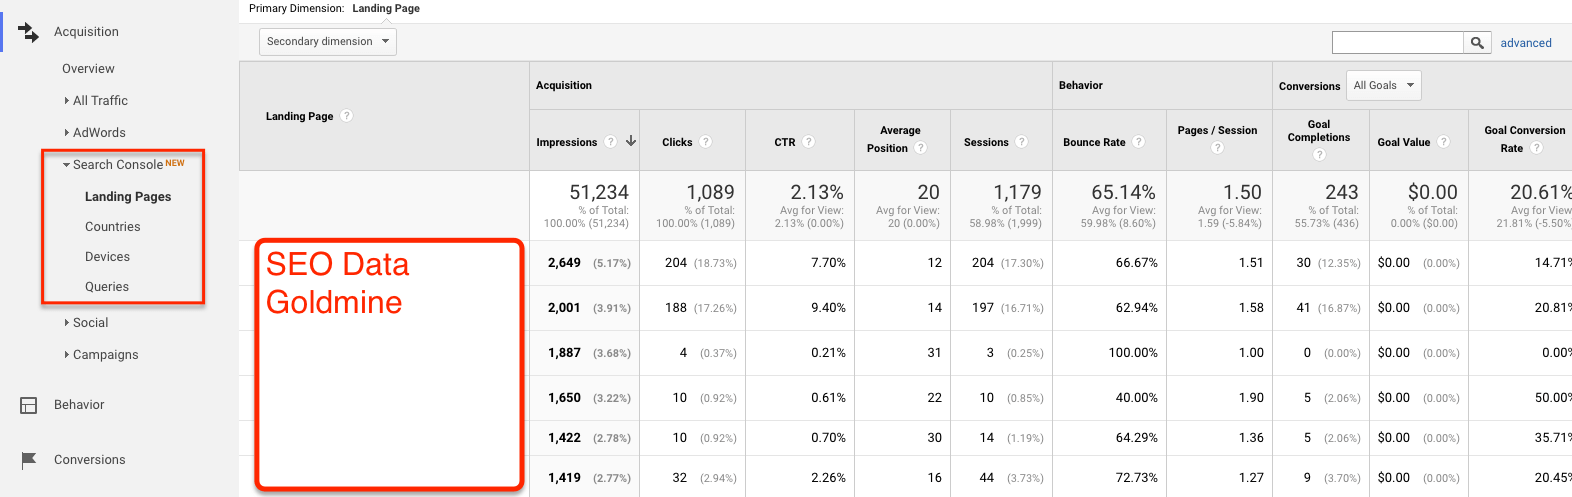
You can also integrate with the Search Console to see how your landing pages are performing. Are certain pages great at driving people to your site, but low in the Google search results? Are certain keywords driving you to appear in search results, but resulting in a below-average click-through-rate? By integrating your Search Console data with Google Analytics, you can see all of this data and optimize your site to increase CTR.
Lastly, you can use the Campaign view to track visitors who came from campaigns you’ve set up on your own using UTM parameters. Remember, these results are for campaigns you’ve structured using UTM codes — not your ad campaigns that sync automatically.
Behavior
The Behavior reports are all about seeing what visitors are actually doing on your website. By using these user behavior reports, you can asses the performance of your website content and determine if your visitors are taking the actions you want them to.
When you first access the Behavior tab, you’ll again see an Overview. This view gives you a graph showing the amount of traffic your website received during the time period you’re looking at.
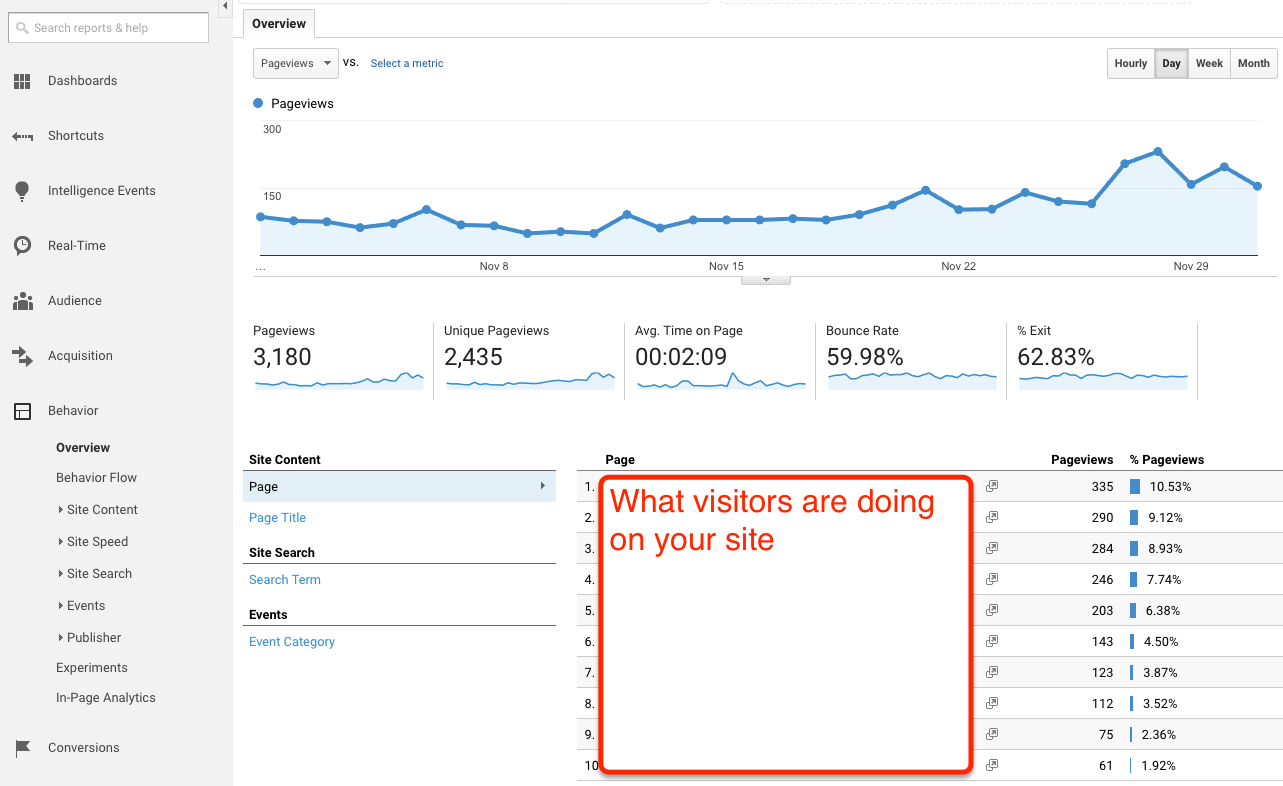
You’ll also see pageviews, unique pageviews, average time on page, bounce rate metrics, and percent exit metrics. All of these metrics describe how a user interacted with your page. Here are some quick definitions:
- Pageviews: Total number of pages viewed.
- Unique Pageviews: Number of individual people who have viewed a specific page at least once during a visit.
- Average Time on Page: The average amount of time users spend viewing a page.
- Bounce Rate: The percentage of single-page visits. (For an in-depth lesson on bounce rate and how to use it, see here.)
- Percent Exit: Percentage of users who exit from a page or set of pages
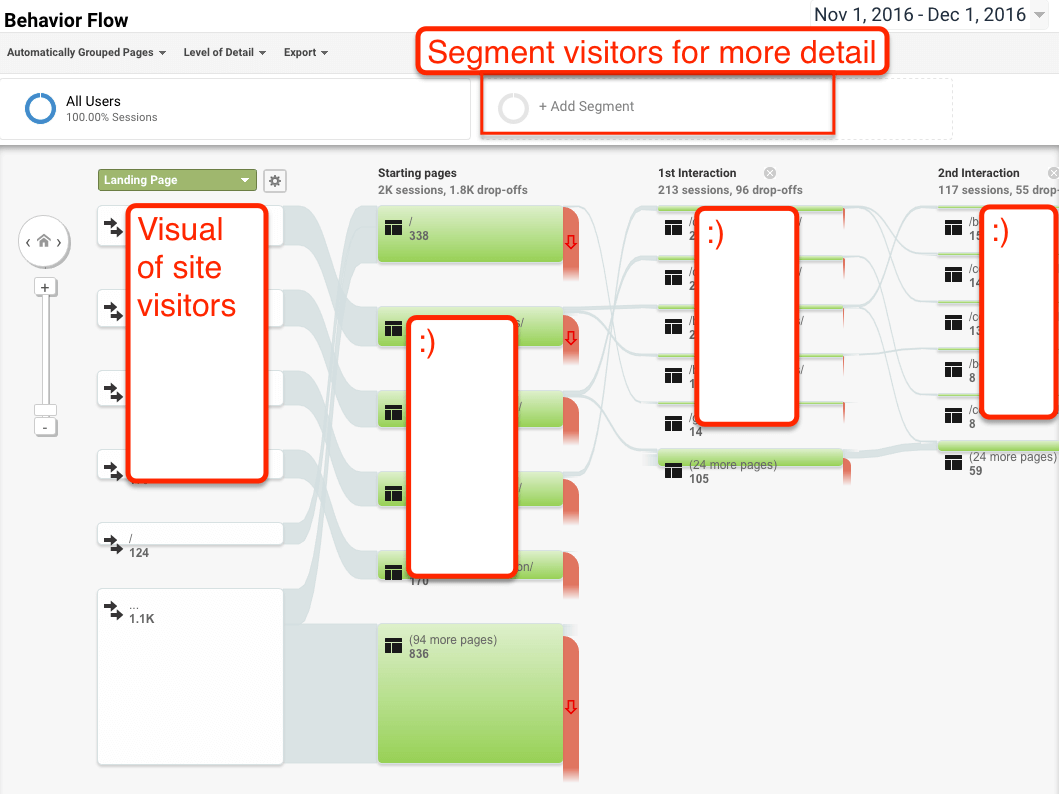
After the Overview tab, you’ll find the Behavior Flow view. This shows the path visitors commonly take when they visit your site, from entering to exiting. Use this to see where it is that people tend to enter and drop off.
Understanding Site Content
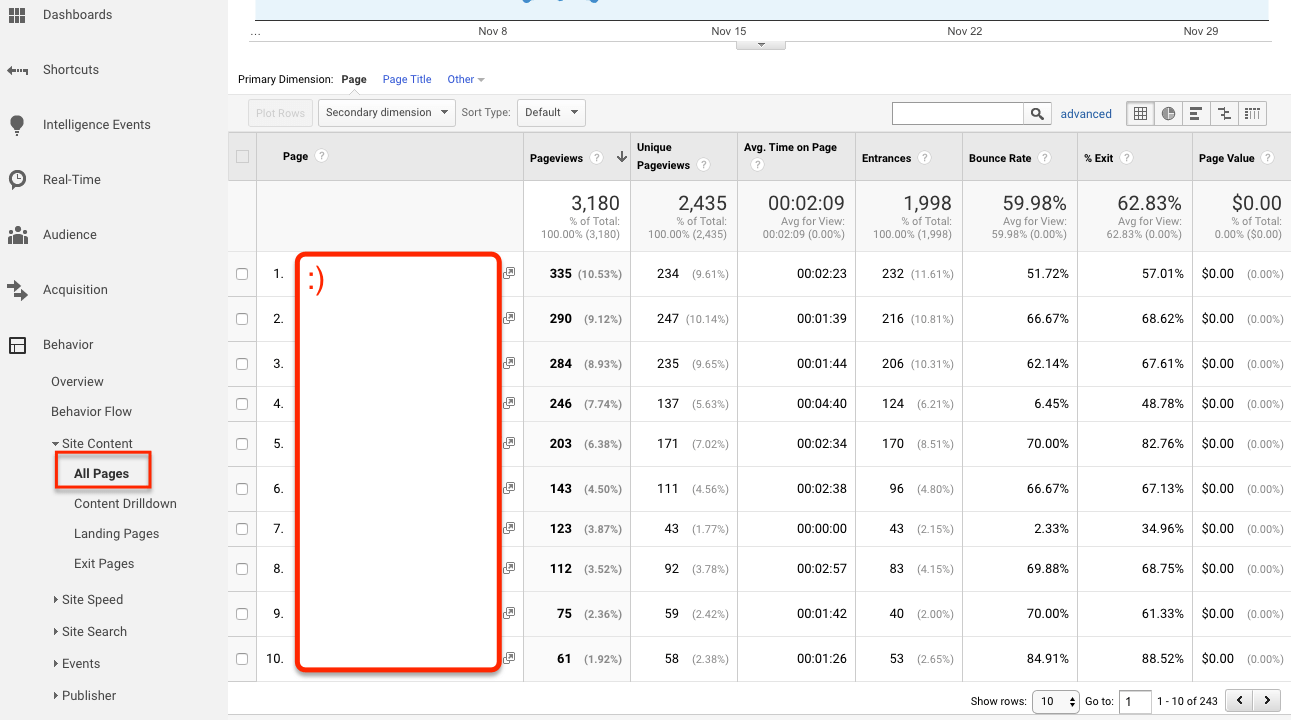
Next up is the Site Content section, which reports on how visitors interact with various pages (or pieces of content) on your site. Google Analytics breaks this down into a few different reports: All Pages, Content Drilldown, Landing Pages, and Exit Pages.
The All Pages report shows the top pages of your site based solely on traffic numbers. Use this to see which content is performing best on your site.
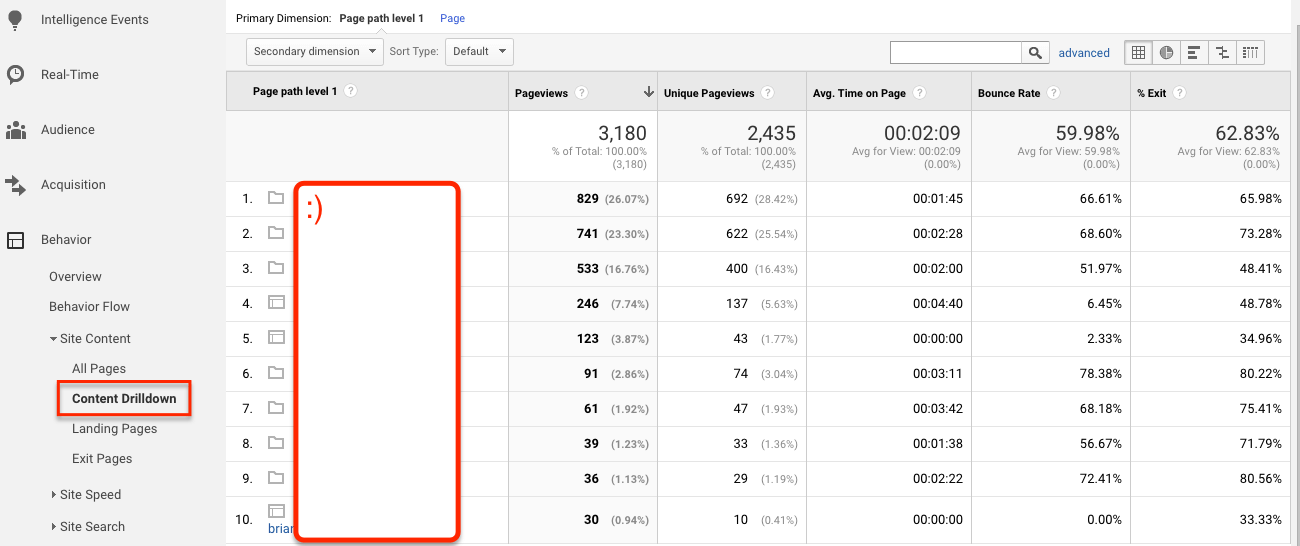
The Content Drilldown report can be used for those areas of your site with folders, such as /blog and /news. This report will show you the top folders of content on your site, as well as the top pieces within those folders. You simply “drill down” into the folders to see individual performance. This gives you a more holistic view of how different content sections are performing on your site.
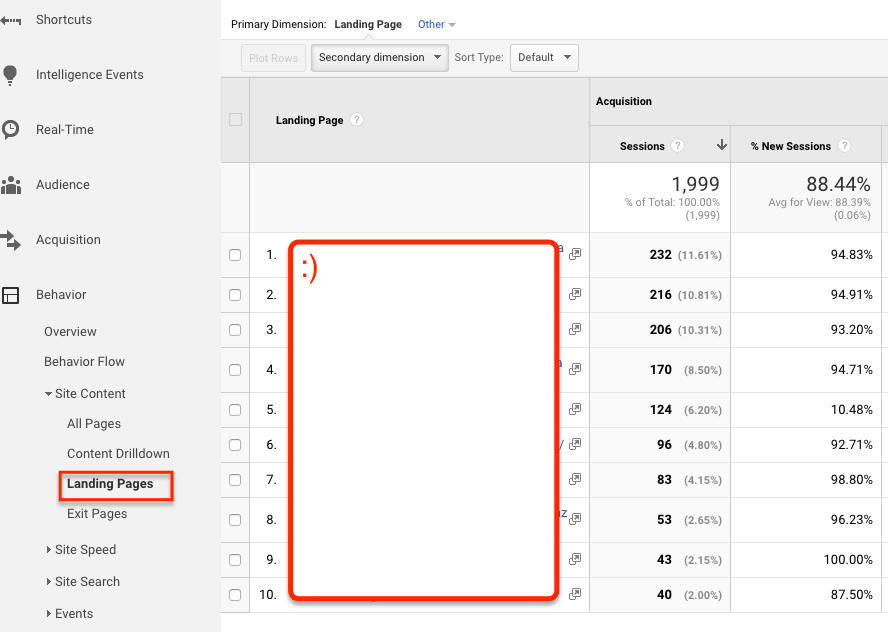
The Landing Pages report allows you to see top landing pages, which is where your visitors enter your site. This report will show you conversions based on your goals, which enables you to see which pages are most likely to lead people to convert. Use this information to optimize your campaigns to direct more traffic to the pages with higher conversion rates.
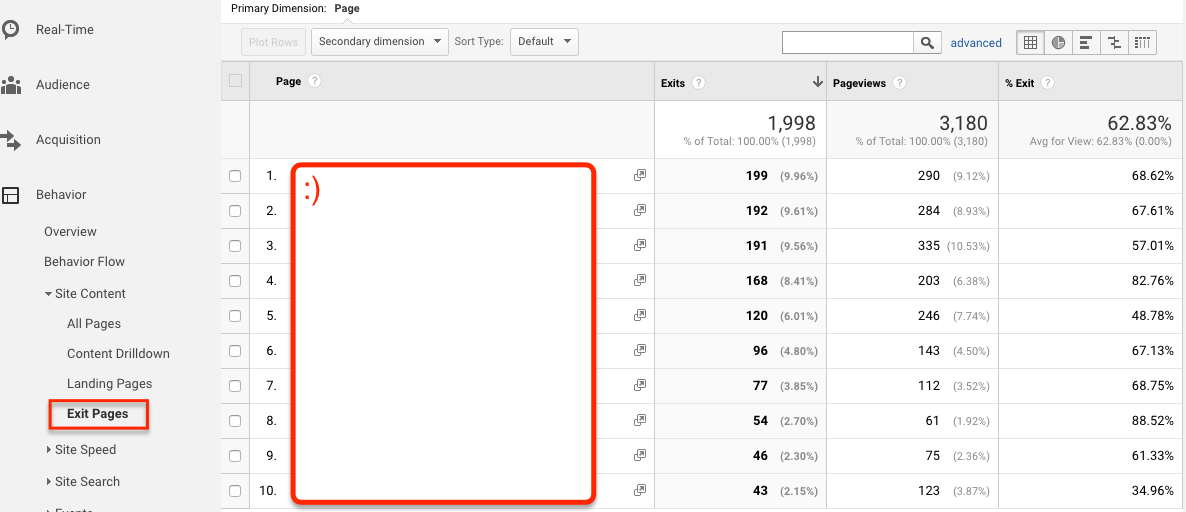
As for Exit Pages, this is all about where people are exiting your site. You’ll want to use this data to see where you’re dropping the ball. Look at these pages to see if you’re missing the opportunity to send users elsewhere on your site.
Understanding the Site Speed
The next section of the Behavior tab deals with site speed — this deals directly with load time. Use this section to determine which areas of your site you may need to optimize due to their slow loading speed.
In the Overview tab, you’ll find a snapshot of the average load time of all pages throughout your website. This is also broken out by browser. Here are a few definitions you need to know (note all times are in seconds):
- Average page load time: The average amount of time it takes for pages to load
- Average redirection time: The average amount of time spent in redirects before fetching a page
- Average domain lookup time: The average amount of time spent in DNS lookup for a page
- Average server connection time: The average amount of time spent establishing a TCP connection for a page
- Average server response time: The average amount of time your server takes to respond to a user request (a big factor for hosting companies)
- Average page download time: The average amount of time it takes to download a page
The Page Timings report shows you how long your most-visited pages take to load compared to the overall load time of your site. Use this to determine which pages you need to optimize due to their slow load speed.
To optimize the slower pages, check out my guide to improving website speed.
Up next you’ll see the Speed Suggestions report, which gives you advice from Google on how to optimize specific pages on your site. It also gives you detailed information for each page!
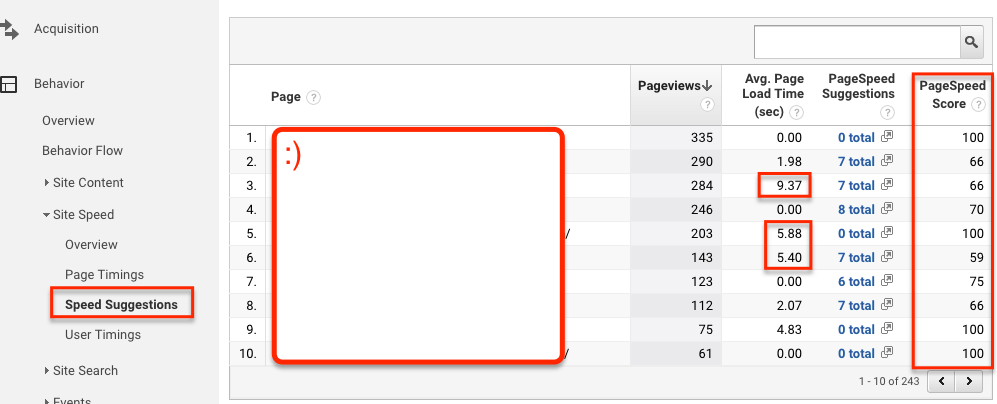
Don’t get bogged down here — start with your pages that see the highest amounts of traffic. Those are the ones that really matter.
Last is User Timings. This feature requires special code on your website (in addition to the regular Google Analytics tracking code). If you decide to move forward with this feature, you’ll be able to see how fast specific elements on a page load — like a video. From there, you can see if it’s affecting user experience.
Understanding Site Search
Another feature of Behavior reports is Site Search, which shows how people are using the search function of your site.
In the Overview tab, you’ll see overall metrics for visitors who use the search box on your website. You’ll also be able to see the search terms they used, as well as the page they landed on. Use this information to find keywords you can be using in Google Ads.
The Usage report shows the number of visits where the search box was used vs. those when it wasn’t. This will help you see whether your search box is improving metrics like bounce rate and conversions.
The Search Terms view gives in-depth information about the search terms people are using on your site, such as how many times that term was used, the number of pages that term triggers, and the percentage of search exits and refinements. You can use this data to determine how easy it is to find information on your site, as well as what information people are searching for — then, you can make ads that drive users straight there.
Lastly, there’s the Pages report. This is a replica of the search terms report, but instead of focusing on the term, it’s focusing on the pages where searches originated.
Understanding the Events
Events are for tracking specific interactions on your website, like clicks on external links, video plays, resource downloads, etc.
This section requires a special tracking code in order to work. If you are using a WordPress plugin like MonsterInsights, then it will work automatically.
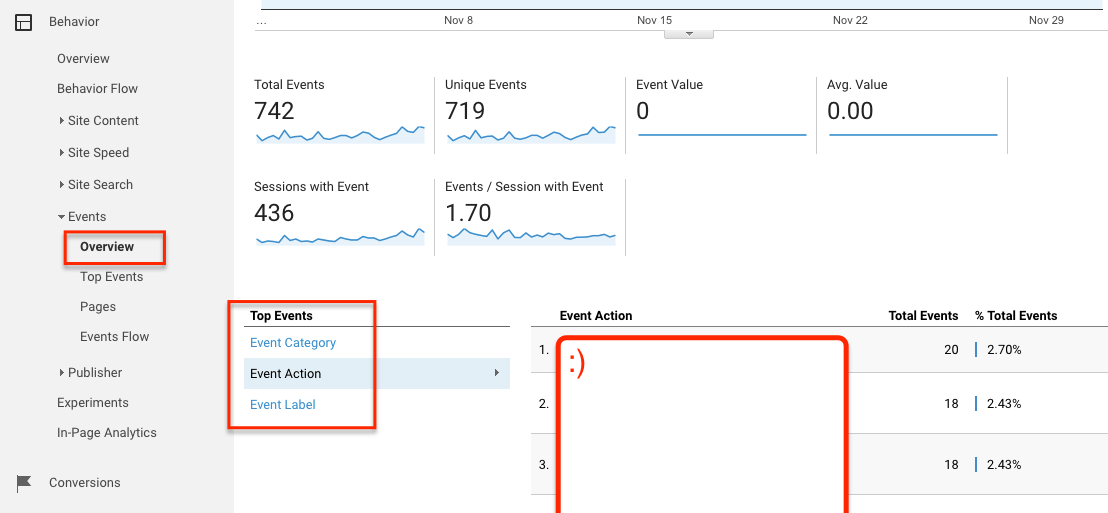
The Overview report shows a summary of interactions you’re tracking. These are tracked based on the event tracking code you set up. So, if you’re tracking newsletter sign-ups and video plays, that information will show up here.
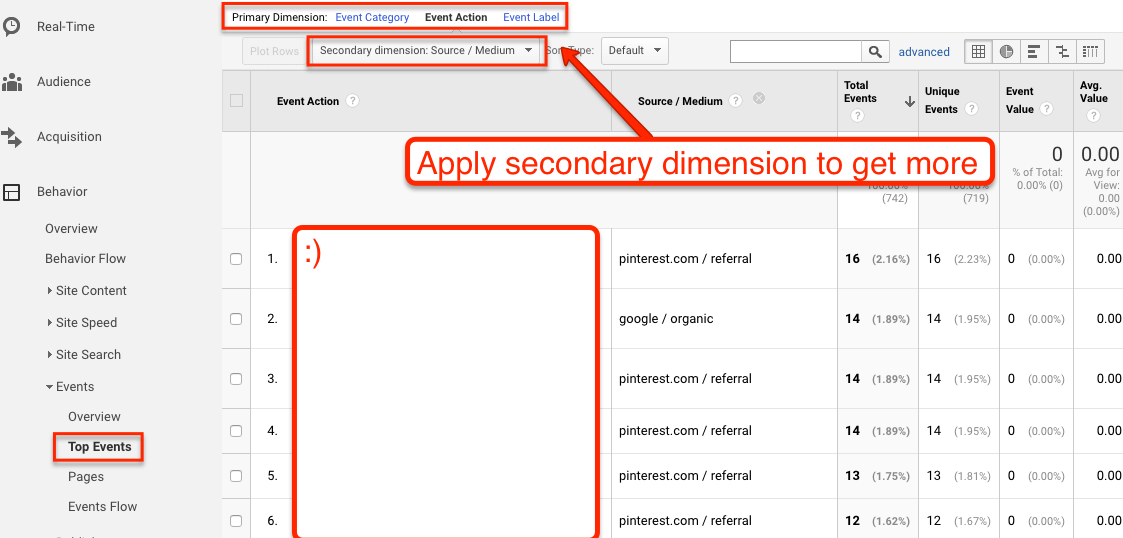
The Top Events report is all about the events with the most interaction. So say you have multiple video downloads. Use this section to see which video is being downloaded the most. This can tell you what your audience is most interested in — then, you can create more of this type of content.
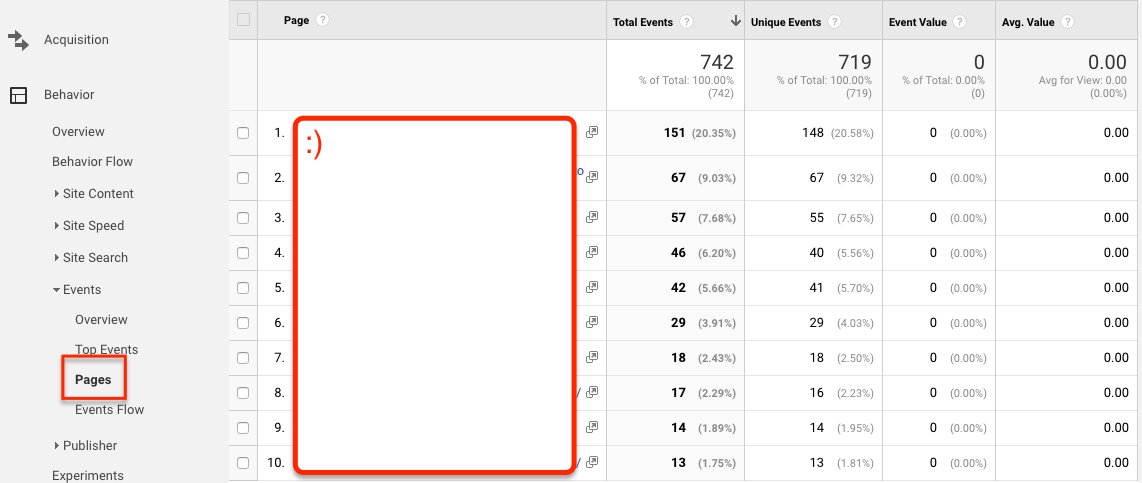
The Pages report under Events shows you the top pages where visitors interact with your events. So, if you’re working with multiple pages with assets, you’ll not only see which events perform the best, but which pages get the most event traction. This can help you with optimizing your pages and focusing more of your efforts (and events!) on the pages that are performing well.
Next, you’ll see the Events Flow report, which shows the path visitors take when they interact with your event. You’ll be able to see where people are arriving, and where they’re dropping off.
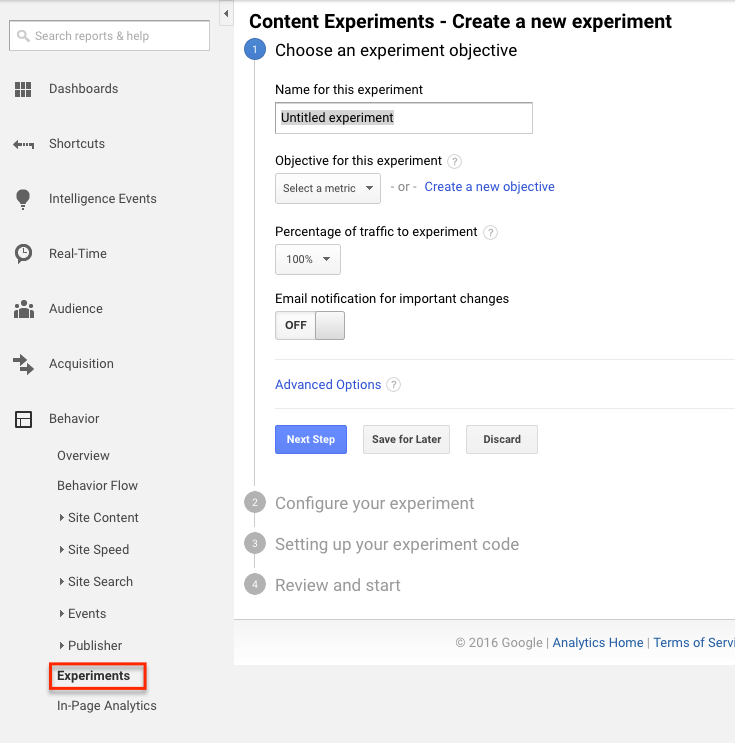
Last but not least, there are Experiments. Google lets you run experiments, such as A/B tests, to see which landing page performs best for your specific goals. If you want to optimize these goals, you’ll want to use Experiments to see which pages are performing best, and which pages need to be adjusted.
Conversions
The Conversions section of Google Analytics is all about understanding how people convert on your website, which is essential to improving your conversion rate.
Conversion reports are broken into four sections: goals, eCommerce, multi-channel funnel, and attribution. Let’s take a look at what these entail.
Understanding Goals
The Goals section starts off with an Overview tab, like the rest of the sections. In the overview, you’ll see a quick summary of the number of goal completions made on your website, which is the total number of conversions.
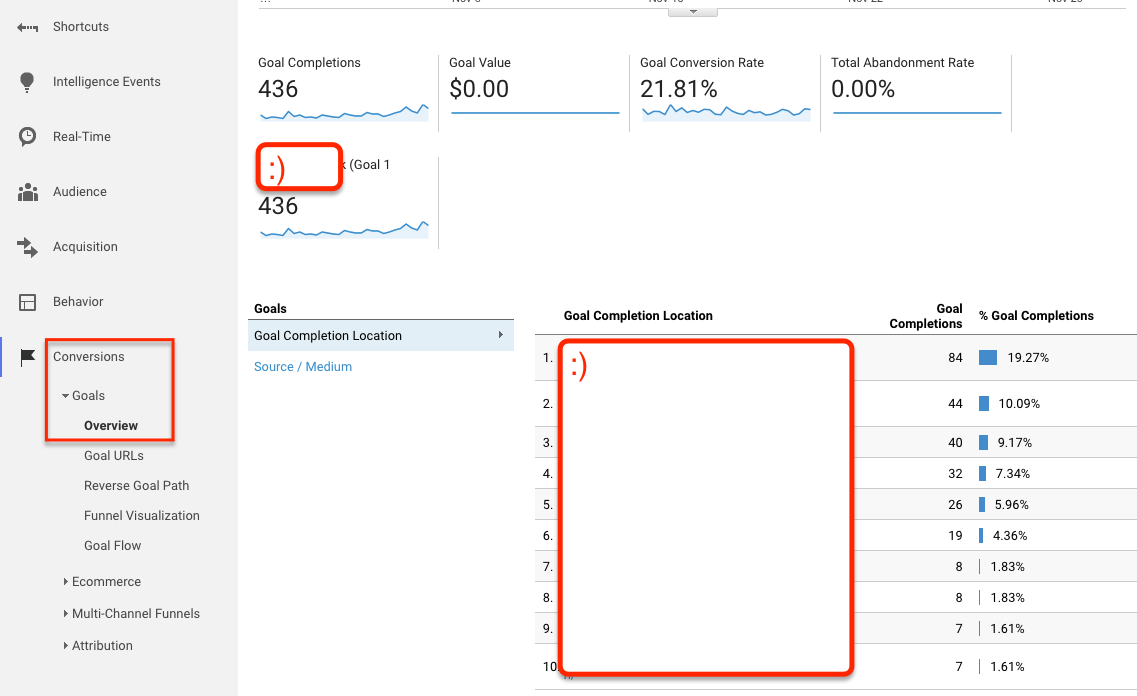
It’s important to note here that in order to be successful, you’ll want to set up good goals. For example, if you’re running an eCommerce business, you’d rather track purchases than filled carts, right? That’s a more adequate view of how many people actually converted. Make sure you’re setting yourself up for a win by creating specific (and accurate) goals.
Next, you’ll find the Goal URLs report, which shows the URLS where people actually convert. The primary view is just the actual goal completion page (i.e. the thank you page after a sign up). To see the page that leads to this completion, use the secondary dimension drop-down to see “Goal Previous Step -1”.
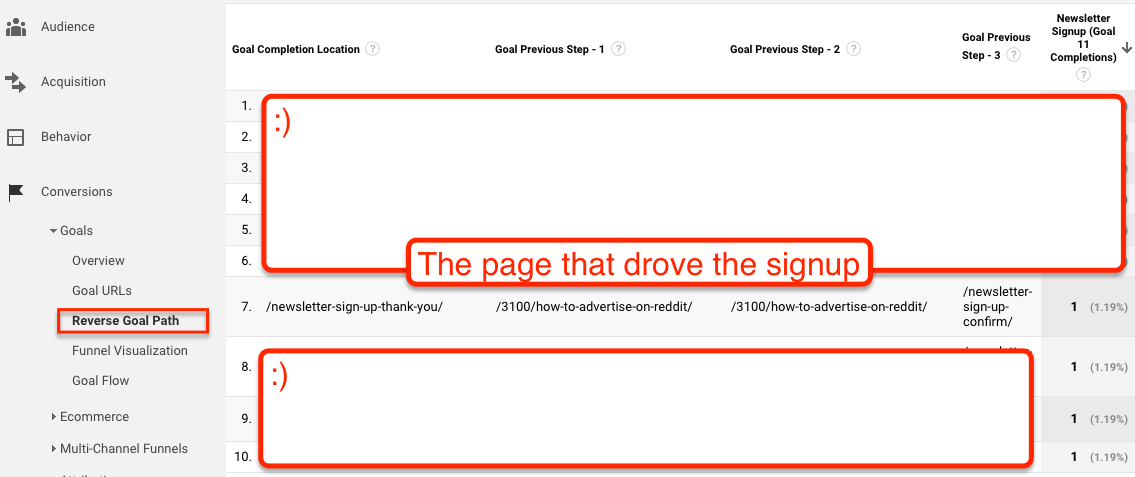
The Reverse Goal Path report works similarly to the Goals URL report but shows you the previous three steps to goal completion. Use this to see the pathways people take to conversion as well as how many steps it takes someone to get to that converting stage.
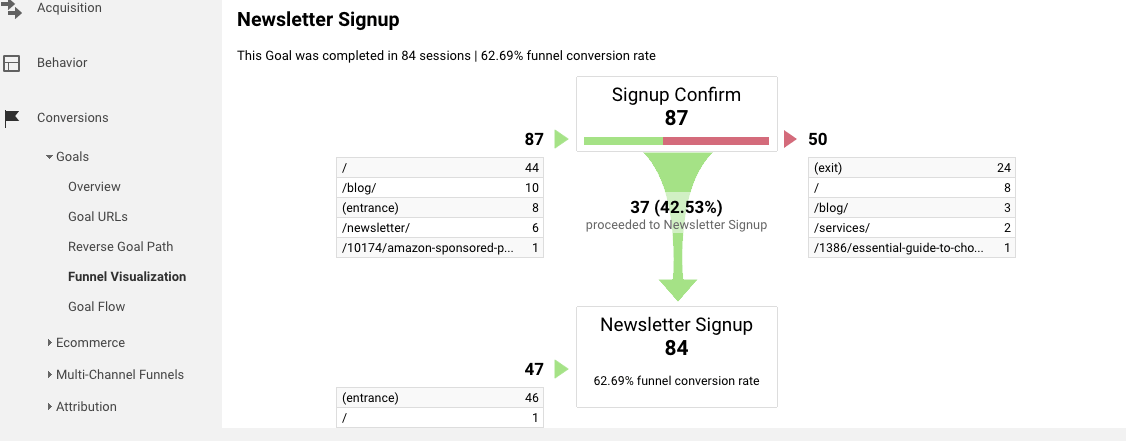
Next, take a look at Funnel Visualizations. This only works if you set up the Destination Goal to track multiple steps in the conversion process. Essentially, what you’ll see is the typical path of the conversion, as well as where people are dropping off in the process. This can help you find hurdles to conversions — like a complicated checkout process, or a broken cart page.
You can also use the Goal Flow Visualization report in the same way.
Understanding the eCommerce Section
Next up under conversions is the eCommerce section, which is specific to businesses selling products on their site.
In the Overview report, you’ll see your eCommerce conversion rate, average order value, unique purchases, and even the quantity of products sold.
There are also a few detailed reports here, too. The Product Performance report will show how your individual products are performing. Use this to see which products are excelling, and which aren’t. Look for trends in seasonality and price.
You can also look at the total revenue you’ve garnered by using the Sales Performance report. This breaks down your sales performance on a daily basis.
Next, you’ll see the Transactions report, which breaks down revenue, tax, shipping, and quantity of items purchased for every transaction made during the time frame you’re measuring.
Lastly, you have Time to Purchase, which shows the amount of time it takes a visitor to purchase an item after arriving on your site. Use this data to see if there are hurdles in the purchasing process.
Understanding the Multi-Channel Funnels Section
Use Multi-Channel Funnels to get a complete view of a customer’s journey on your site. Instead of attributing the conversion to the last referral, as Google does, this section helps you see other actions a user takes that help them convert — such as reading a blog post, downloading a guide, or signing up for a newsletter.
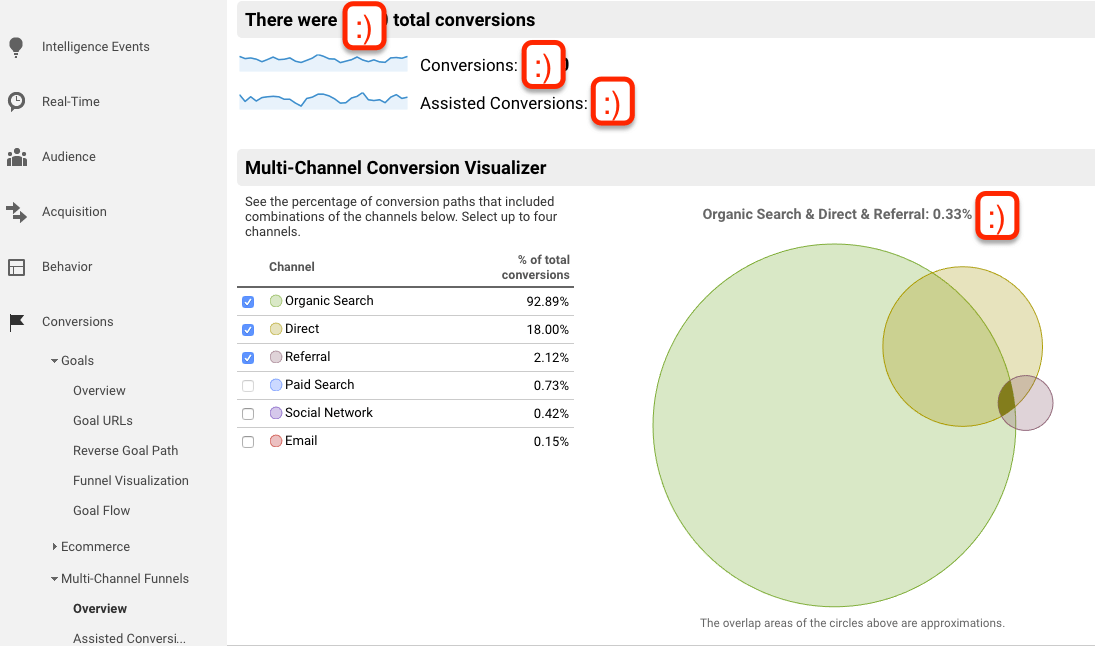
The Overview report shows a summary of each marketing channel that helps drive conversions to your site. Use this to see which channels are contributing more converting traffic. If it’s social, perhaps you want to focus more of your efforts there (rather than paid).
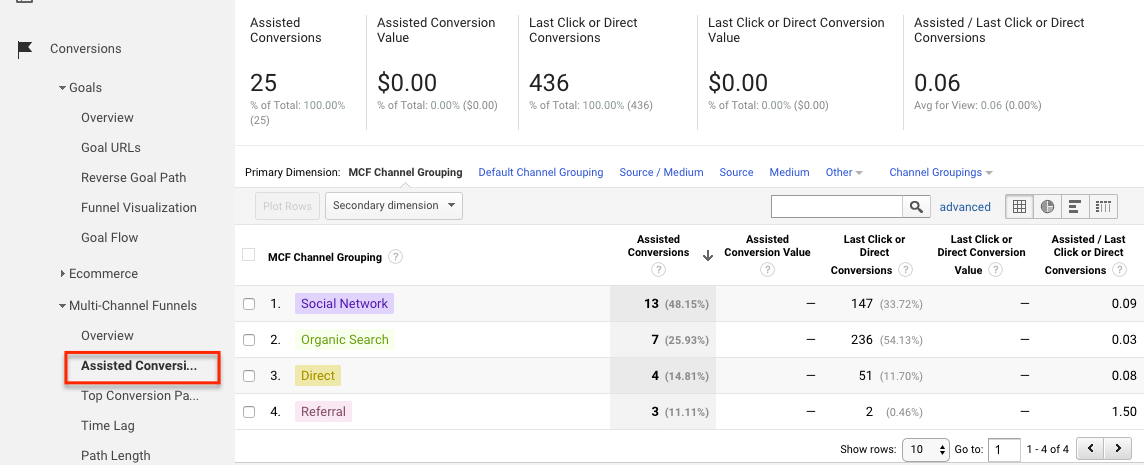
Next is the Assisted Conversions section — this shows the number of conversions that a channel indirectly influenced. For example, your blog may have 50 assisted conversions. It wasn’t the final touchpoint, but during 50 of the 100 times someone visited your blog, they ended up converting at a later time.
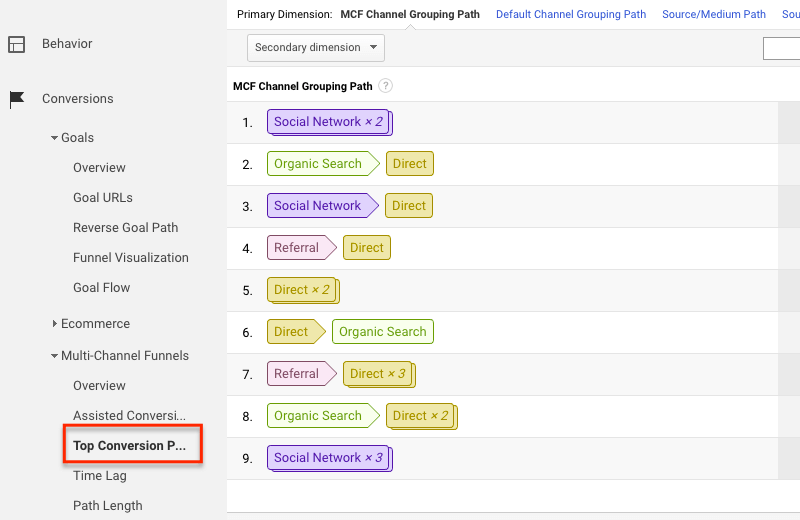
If you want to see the paths converters take, use the Top Conversion Paths report. This shows the most typical paths to conversion users take. For example, you may find that most of your users find you on organic search, then come back to your site directly to buy a product from you.
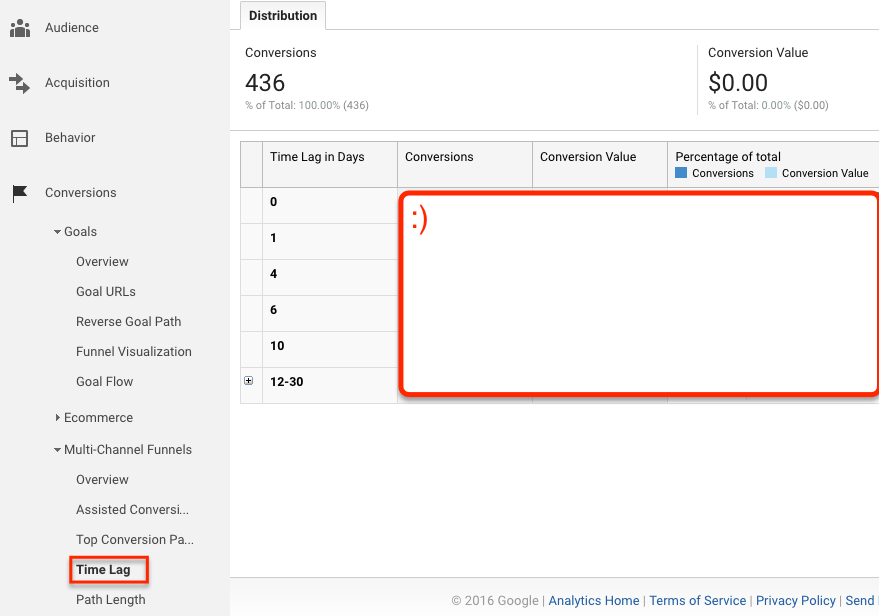
If you want to see how long it takes someone to convert, check out the Time Lag report. This will show you how long (in days) it takes visitors to convert after their first visit to your site. Use this data to optimize your conversion process.
Similarly to time lag, the Page Length report shows the number of interactions a visitor makes with your site before they convert.
Understanding the Attribution Section
The Attribution section of Google Analytics has just one report: the Model Comparison Tool. You can use this to understand the difference in conversions when you change attribution. For example, say you think an ad, which was a user’s first touchpoint, should receive the conversion. You can see how your conversion numbers change when you change the attribution of the conversion to this first interaction.
This can help you see how different marketing channels are affecting your overall conversions, such as paid advertising, email, and content marketing.
Audience
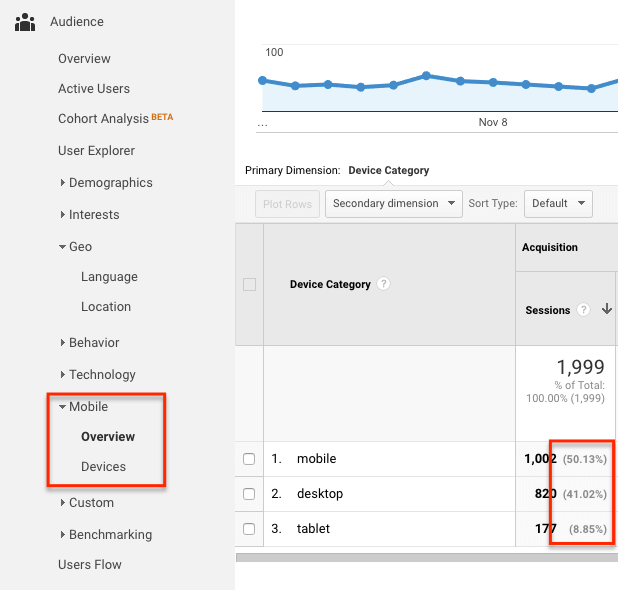
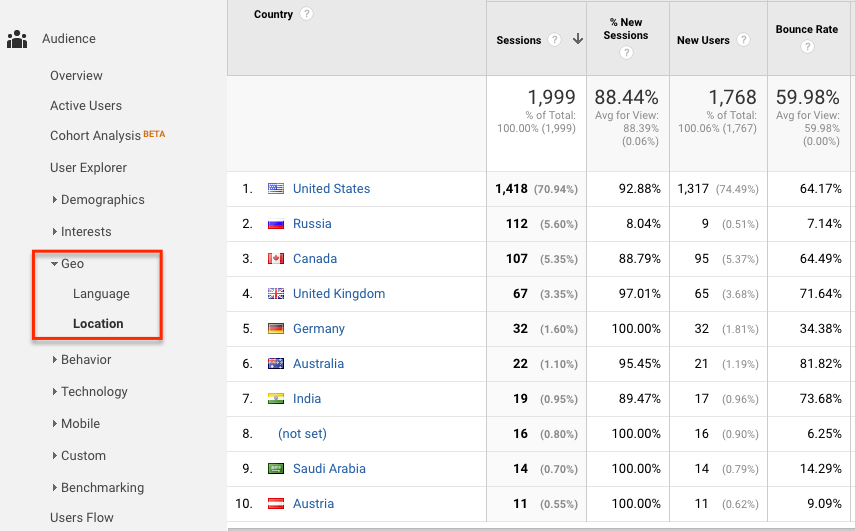
The Audience section of Google Analytics allows you to learn more about who makes up your website traffic. This section emphasizes demographics and attributes tied to your traffic. Most reports are self-explanatory, but the Mobile & Geographic reports are likely the most useful.
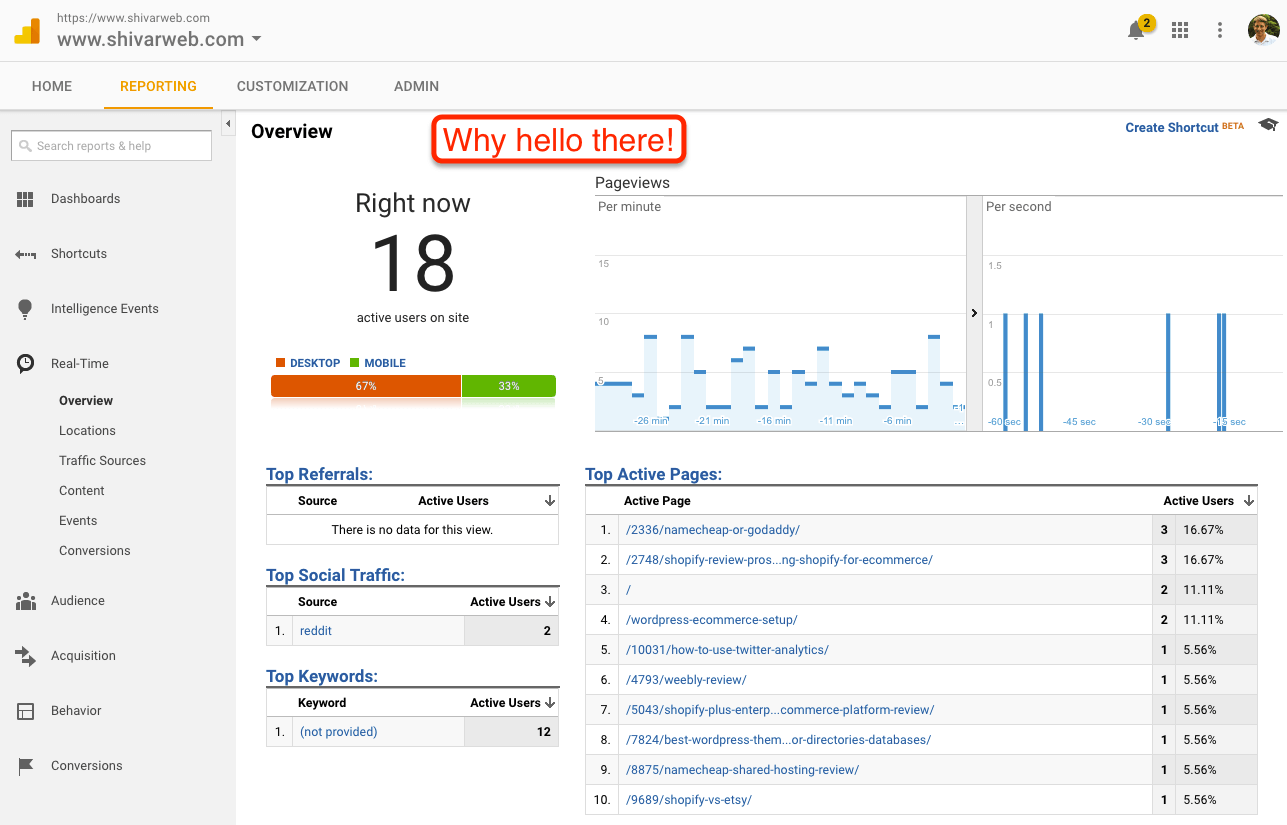
Real-Time
This report allows you to see who is on your site & what they are doing in real-time. If you are running a sale, in the media, or simply want to see site performance in real-time, then this is where you go.
Problem Solving with Google Analytics
At the end of the day, Google Analytics is really a problem-solving tool — it’s not the end all be all, final answer. Data overload is a very real thing, so don’t give in to analysis paralysis. Instead, use good problem-solving techniques.
First and foremost, don’t enter your Google Analytics account looking for a solution. You want to be looking for problems. Is the page speed to slow? Are customers dropping off at a certain point on the site? All of these are issues that you can identify using Google Analytics. Only then can you dive into the root cause of the problem and how you plan to fix it.
Second, Google Analytics is a tool that can go wrong. It’s important to understand where Google Analytics spam comes from & what do you about it. It’s also useful to understand how to sort unimportant information (or plain wrong information) from your view so that you can look at what is important.
Next Steps
Now that you know how Google Analytics works, it’s time to dive on in. Use these next steps to get started:
- Make sure Google Analytics is implemented correctly. You can use Google Tag Assistant to verify that it is. If you are using WordPress, use an analytics plugin to implement it correctly. Be sure to carefully check every Google Analytics setting.
- When you have a question or problem with your website, outline the dimension and metric that will show that problem or answer the question. For example, if you’re wondering if people are finding a certain page through organic search, you’ll want to look at organic traffic to that page (so Channels and Pageviews).
- Once you have the question/problem, dive further into analytics to find the root of it. If you find people aren’t finding your page through organic search, see if you can use the data to learn why.